For example, if
When this command executes, the result is
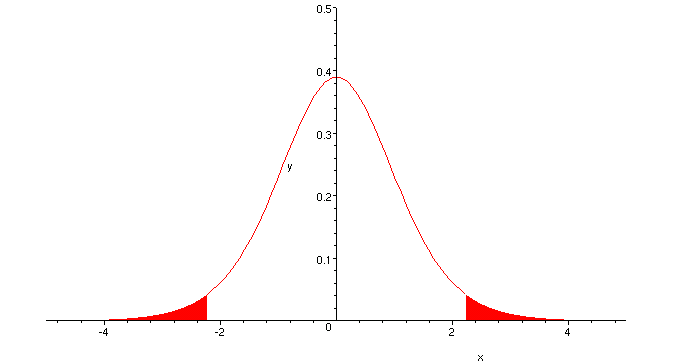
The graph below represents this result. The shaded area goes from ![]() to
to ![]() , and
from
, and
from ![]() to
to ![]() , and has total area equal to
, and has total area equal to
![]() , or
, or ![]() .
.
The two shaded portions each have area ![]() or
or
![]() .
.
These threshold values would be used to construct a two-tailed test or confidence region.

(Note: this is the correct syntax for Excel. It is slightly different for other spreadsheets. Consult the help menu of the spreadsheet you are using to find the correct syntax for your spreadsheet program).