

Next: About this document ...
Up: MINITAB
Previous: Testing Normality with a
Contents
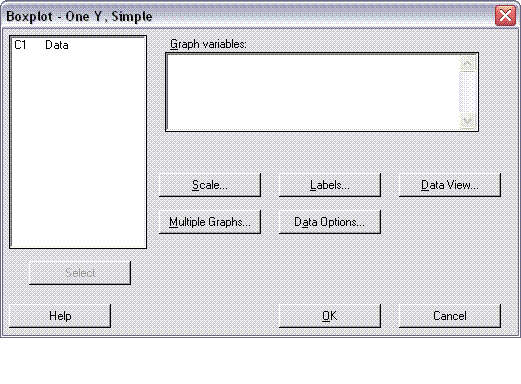
- From the Graph pulldown, select Boxplots. Another box will appear:

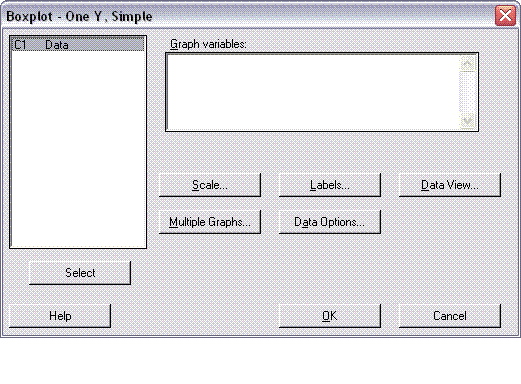
- Click on the column that you want to plot (C1 in this case)

- The entry for C1 should appear highlighted. Click the Select button.

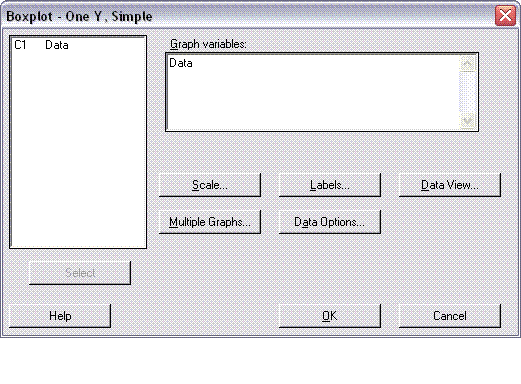
- The data name from column C1 should now appear in the Graph Variables window.
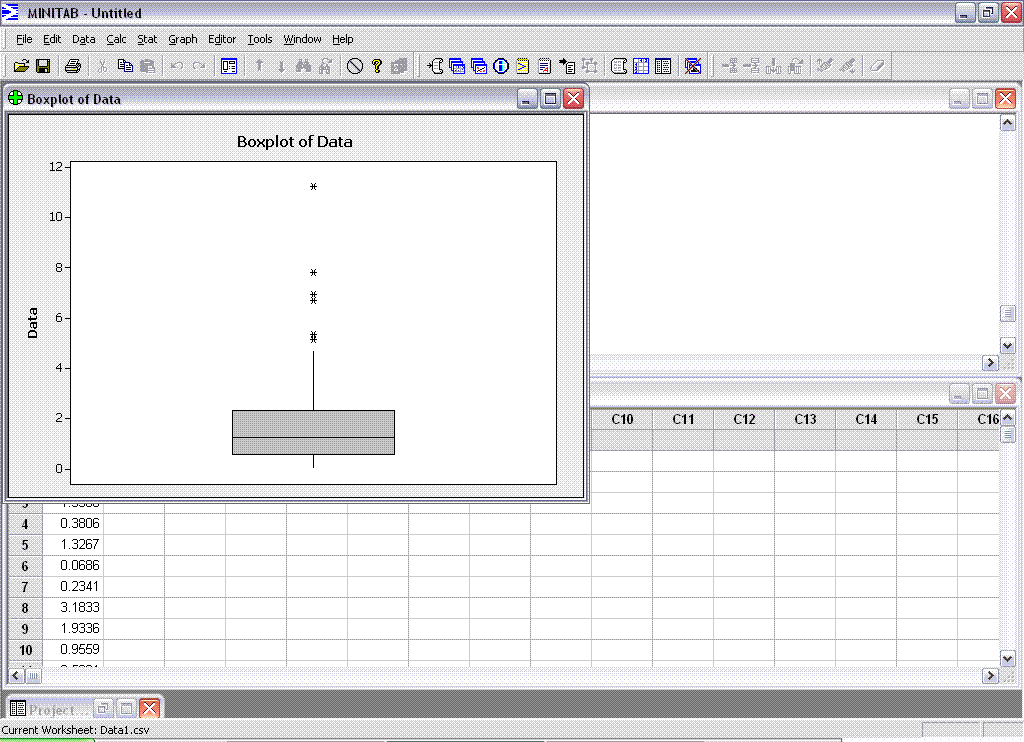
- Click OK to create the probability plot.

gene quinn
2006-12-04