Eugene Quinn's Website

Home
images/Normans

At Norman's Restaurant

Why I Maintain This Page

  • East Greenwich has long enjoyed a reputation for good government and excellent schools. I consider it a privilege to have a role in continuing that tradition.
  • As a 50-year resident, I have paid several hundred thousand dollars in property taxes. I'm proud of what my taxes helped build, and I want to see that investment preserved.
  • I support an evidence-based, data-driven approach to policy making across local government that emphasizes careful analysis and a long term perspective.

Analysis and opinions are my own and do not reflect positions of the East Greenwich School Committee in any way

My substack site

Stories

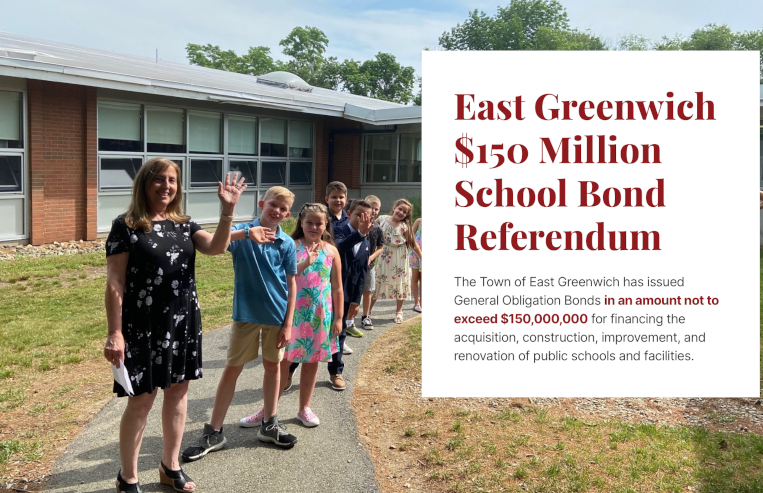
   School Bond Information

http://www.egbondreferendum.com/

School Bond Referendum Tuesday, November 7th

   Municipal Audit History

Taxgraph

Selected pages from municipal audits 1986-2025.

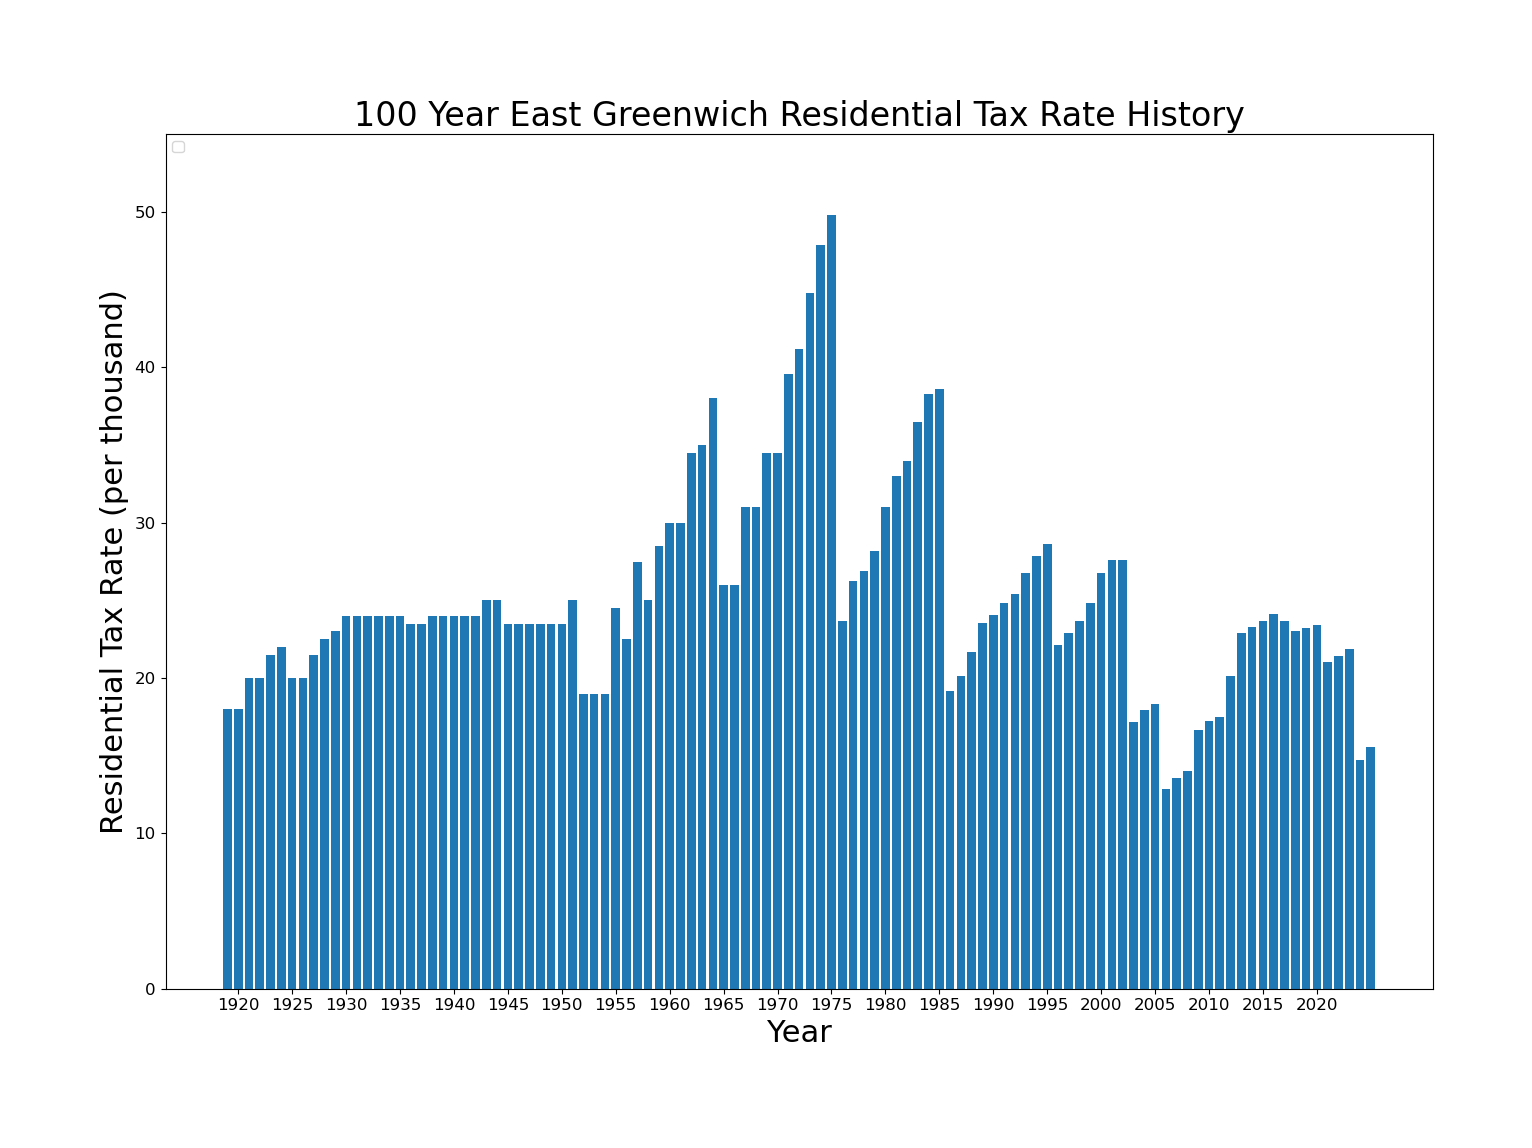
  100 Years of East Greenwich Tax History

taxes
  • The Recapitulation Page is a legal document submitted by the Tax Assessor every year.
  • It provides reliable documentation on tax rates, total assessed value, and total tax levy in a standardized format.
  • These records for East Greenwich are available beginning just after the Civil War
  • Contrary to the narrative of unsustainable tax growth that we have seen, the tax rate is lower today than it was a century ago, and there is no significant trend up or down.
  • That said, the advent of the 4% levy cap guarantees that the tax rate will fall over time, although this will only be evident at the end of revaluation cycles.

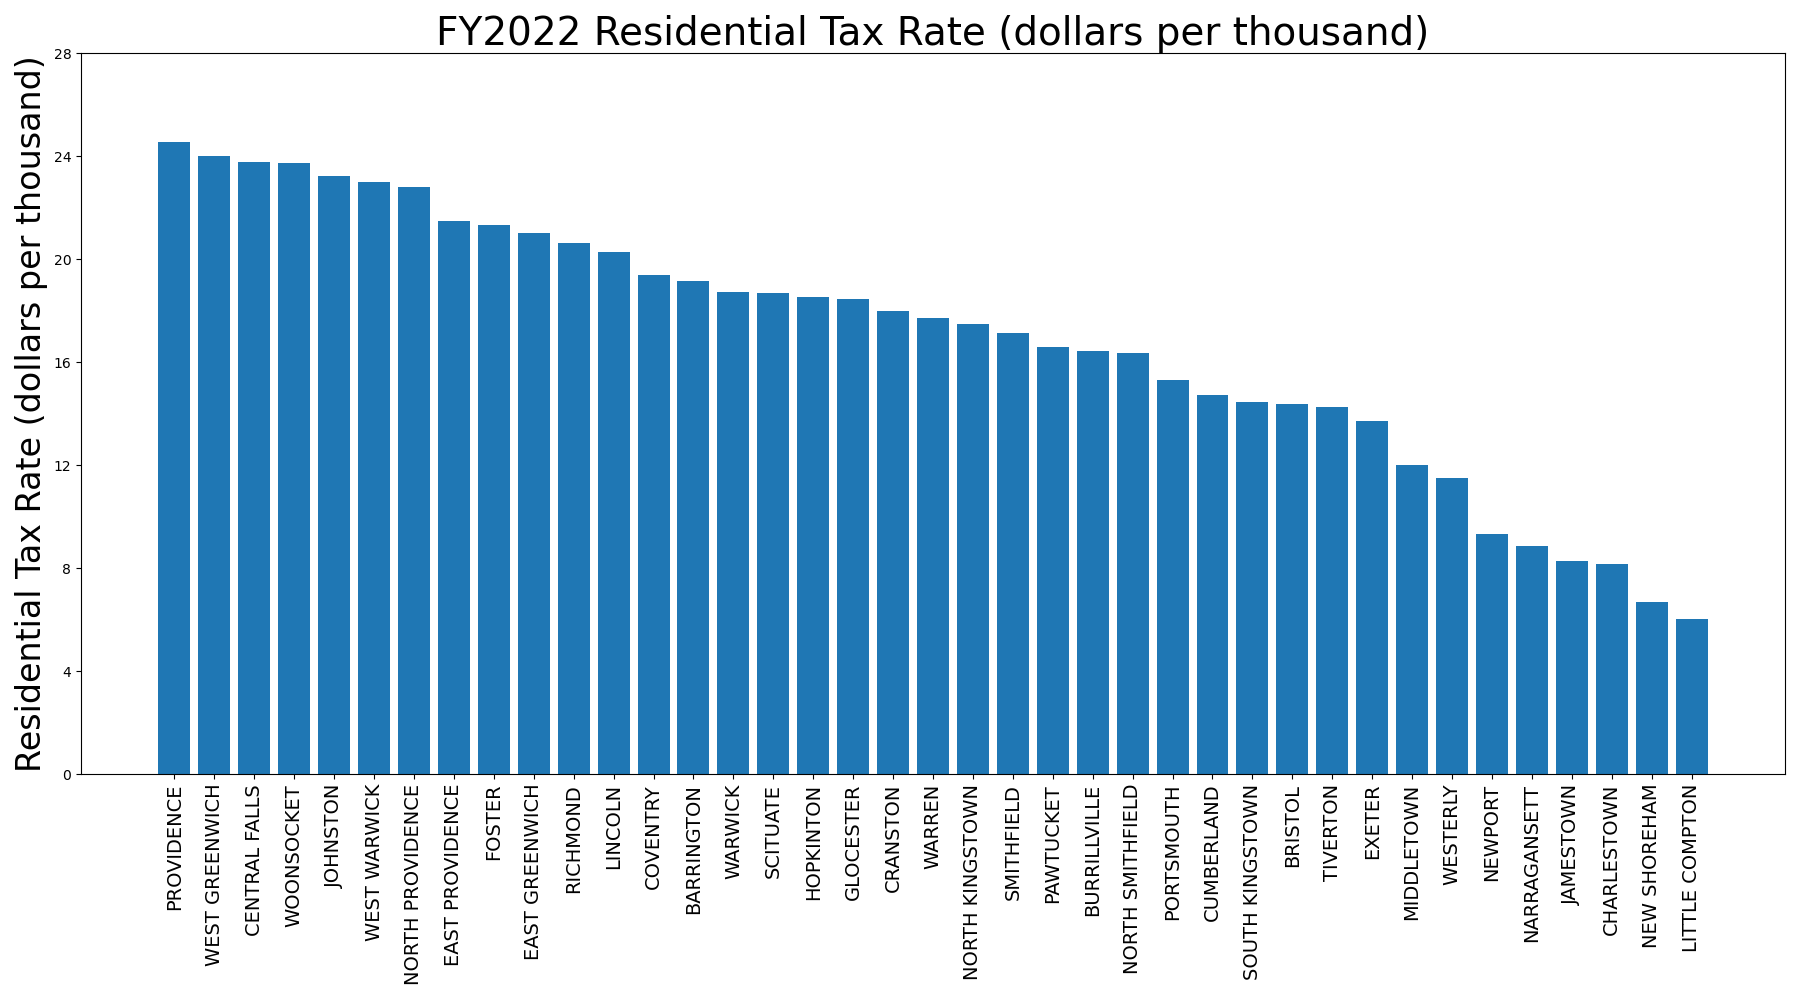
  East Greenwich had the ninth highest FY2022 residential property tax rate. Why?

taxes

    There are three primary reasons:

  • 1. In terms of assessed property value per resident, East Greenwich is not particularly wealthy, ranking 11th. Other towns have a considerably larger tax base per capita.
  • 2. State education aid varies greatly by town. If every town had to raise their FY2022 state education aid through residential property taxes, East Greenwich's adjusted tax rate would rank 19th
  • 3. With 0.20 public school students per capita compared to the state average of 0.12, East Greenwich has more students enrolled in public schools per capita than any other community except Barrington.

   Single Family Home Tax Histories 1992-2023

Taxgraph

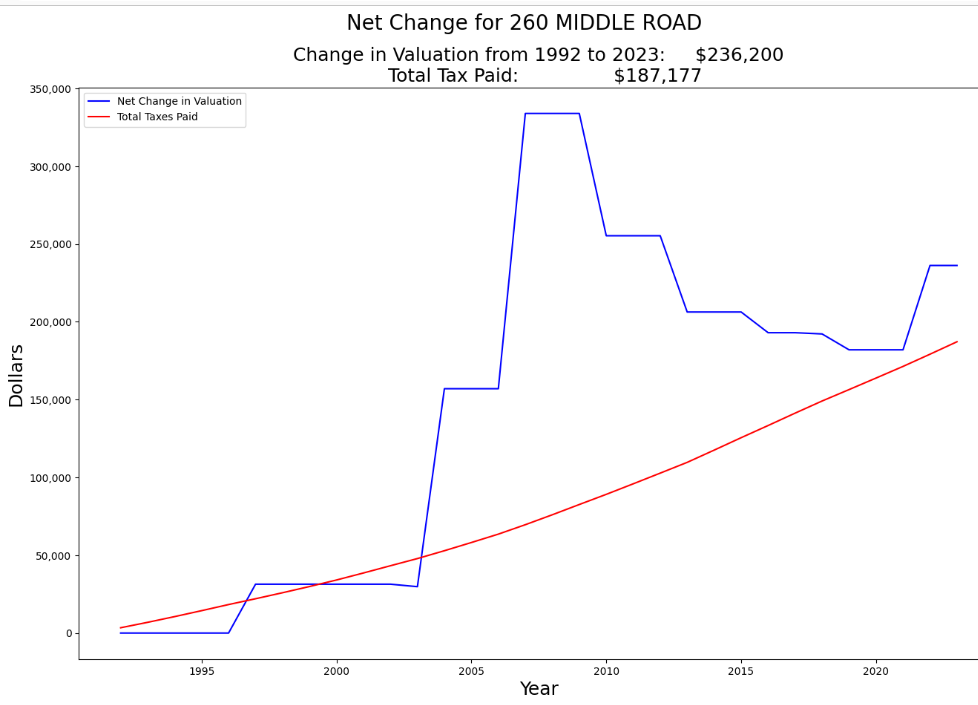
Growth in assessed value generally exceeds taxes paid.

Based on tax records for 3,300 single family homes that were listed as such on both the 1992 and 2023 tax rolls:
  • In round numbers, $860 million in taxes was paid, and total property value increased by $1 billion.
  • The median of the 3,300 growth factors for the assessed value was 3.4, meaning the 2023 valuation was 3.4 times the 1992 valuation.
  • Tax and valuation histories for single family homes are posted here.
  • It is evident from the graphs that the debt service from the Cole construction did not produce a spike in tax bills.