Most tables of the ![]() -distribution have their last entry listed as either degrees of
freedom =
-distribution have their last entry listed as either degrees of
freedom =![]() or
or ![]() , which reflects the fact that, when the number of degrees of
freedom is large (say, several hundred or more), the two curves are nearly indistinguishable.
, which reflects the fact that, when the number of degrees of
freedom is large (say, several hundred or more), the two curves are nearly indistinguishable.
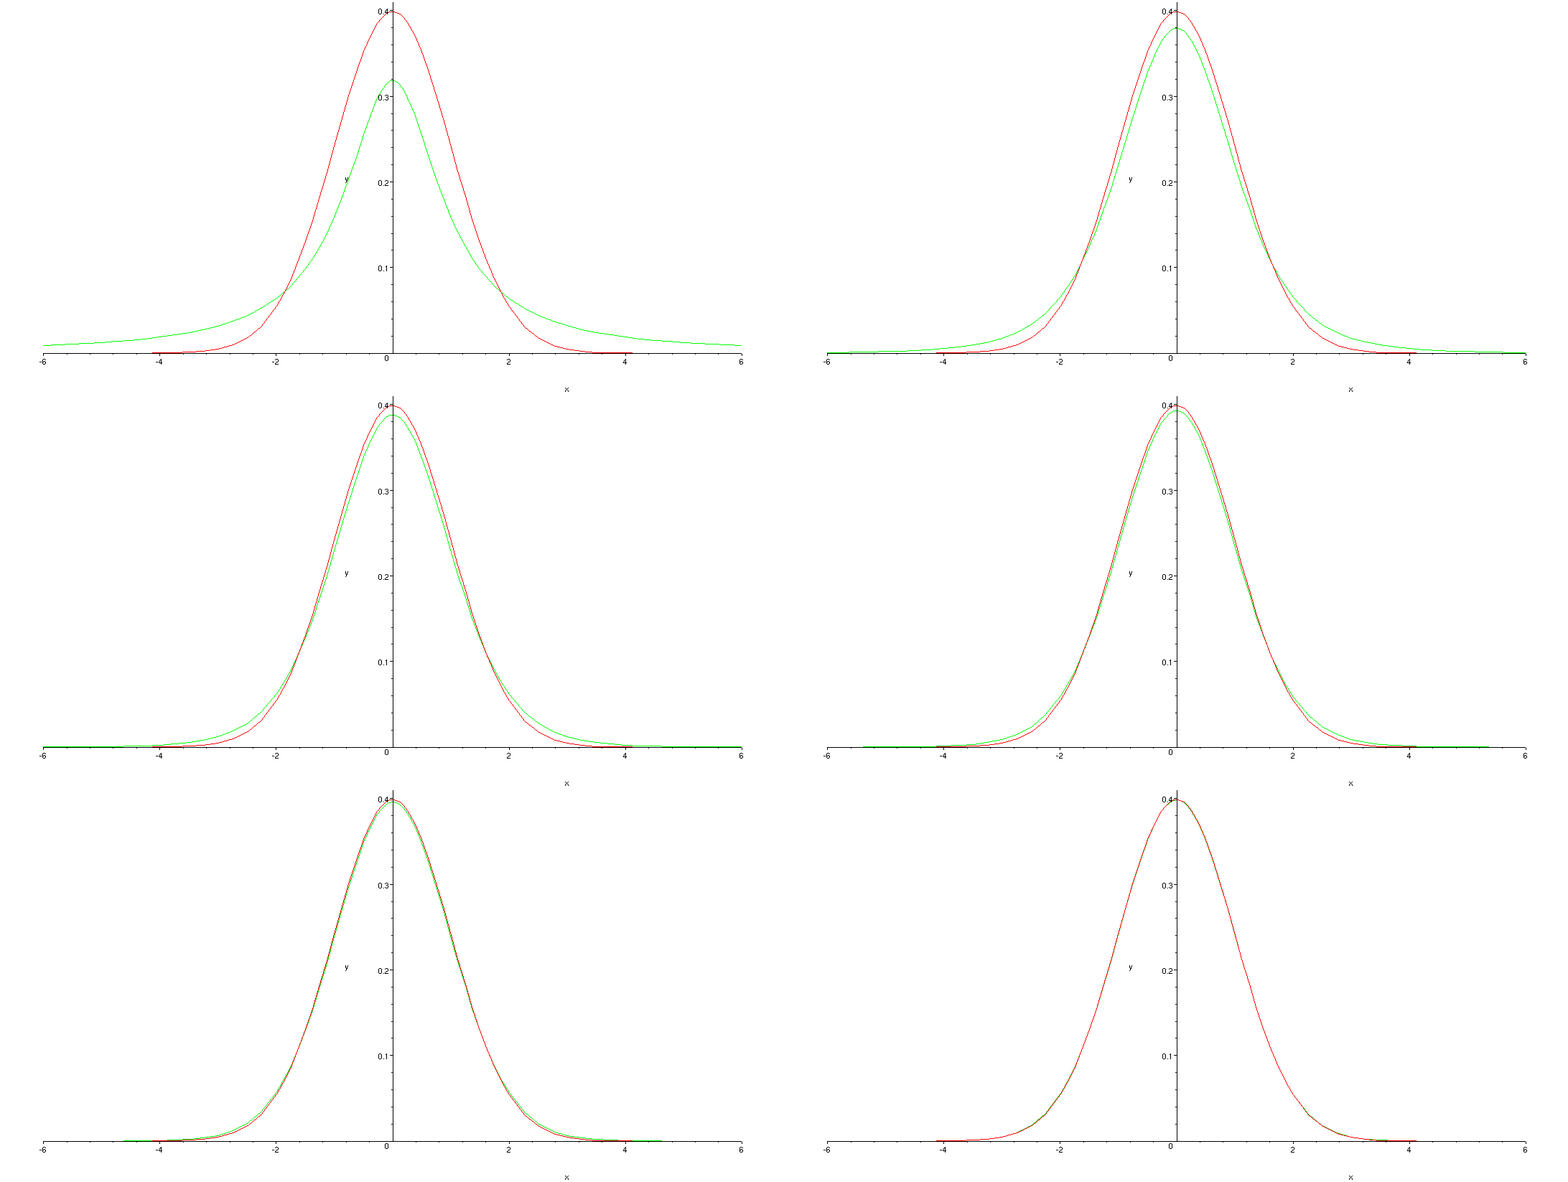
The animation below shows the bell-shaped curves of the ![]() distribution (in red) and the
distribution (in red) and the ![]() distribution (in green) superimposed on one another.
distribution (in green) superimposed on one another.
The ![]() -distribution curve changes shape as the number of degrees of freedom increases, and
quickly becomes nearly identical to the
-distribution curve changes shape as the number of degrees of freedom increases, and
quickly becomes nearly identical to the ![]() -distribution curve.
-distribution curve.
