

Next: MINITAB
Up: Miscellaneous Technology Issues
Previous: Getting Percentiles with the
Contents
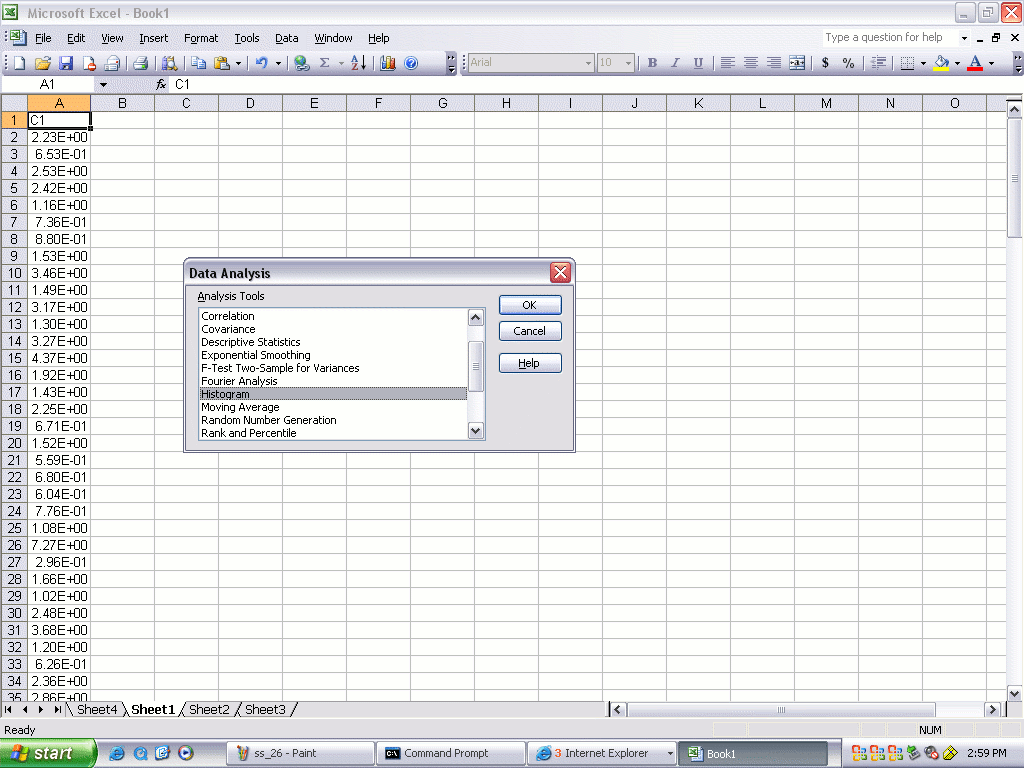
- Pull down the Data menu.
- Select the Data Analysis item,
- then Histogram

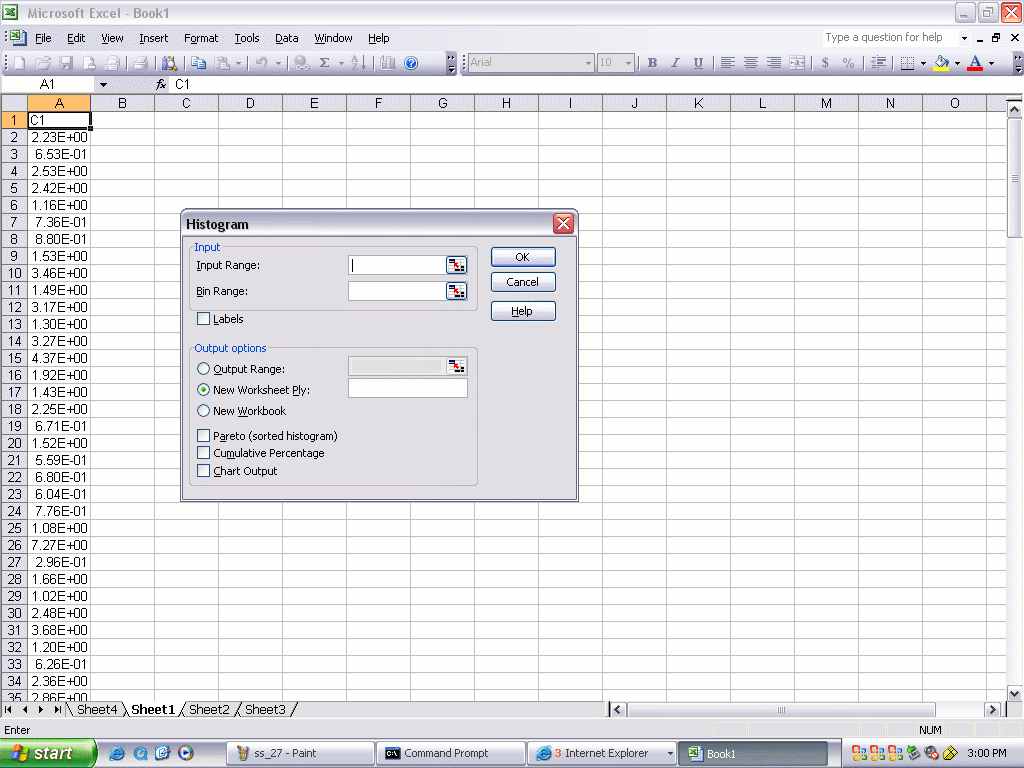
- Fill in the Input Range

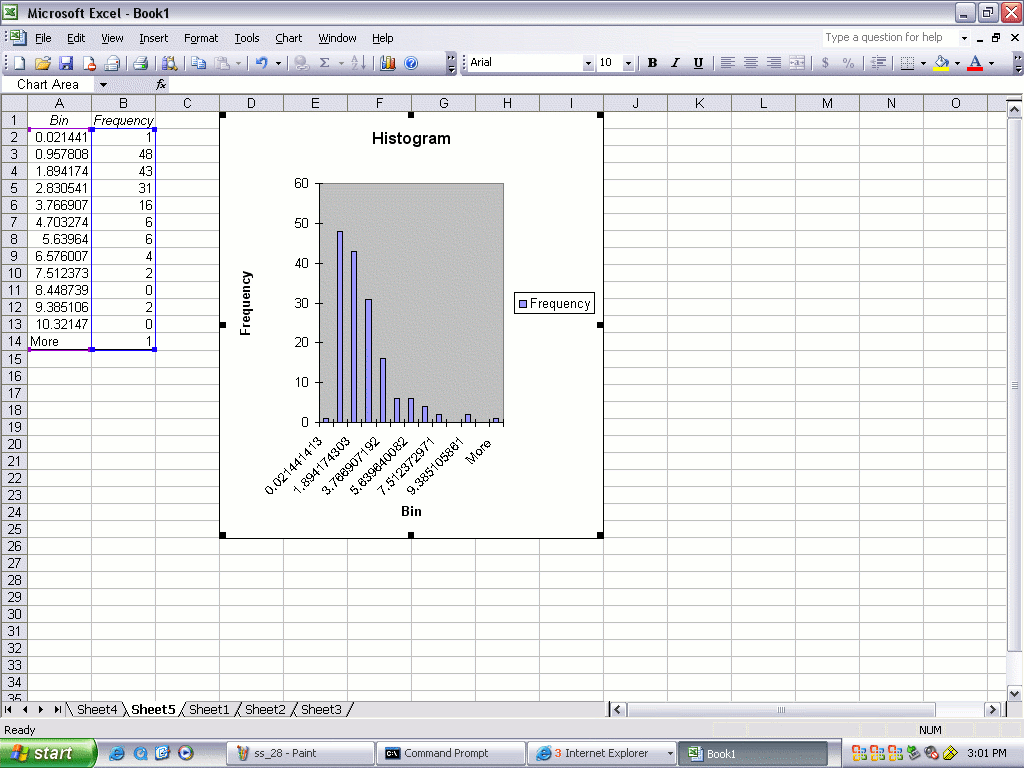
- After expanding the chart, the results should look something like this:

gene quinn
2006-12-04


