MA145-B Assignment 2 Help
Check whether the Data Analysis Routines are Installed
The default installation of your spreadsheet may not include the Data Analysis routines.
You should first check to see if they are using the following procedure:
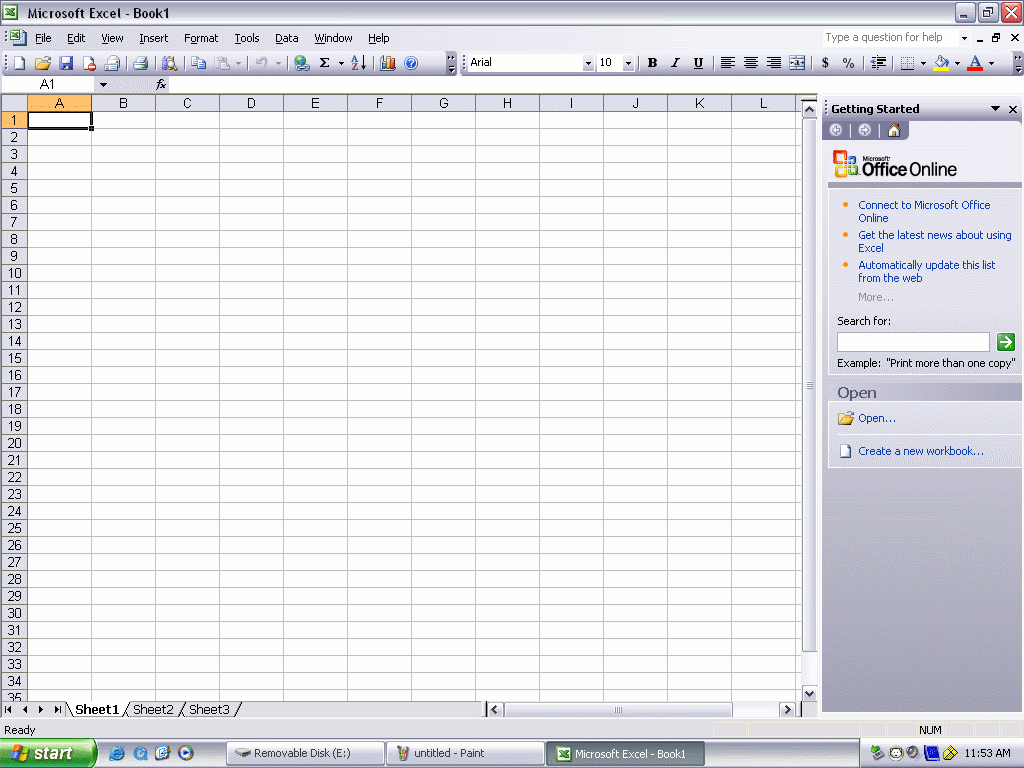
- Open the spreadsheet:
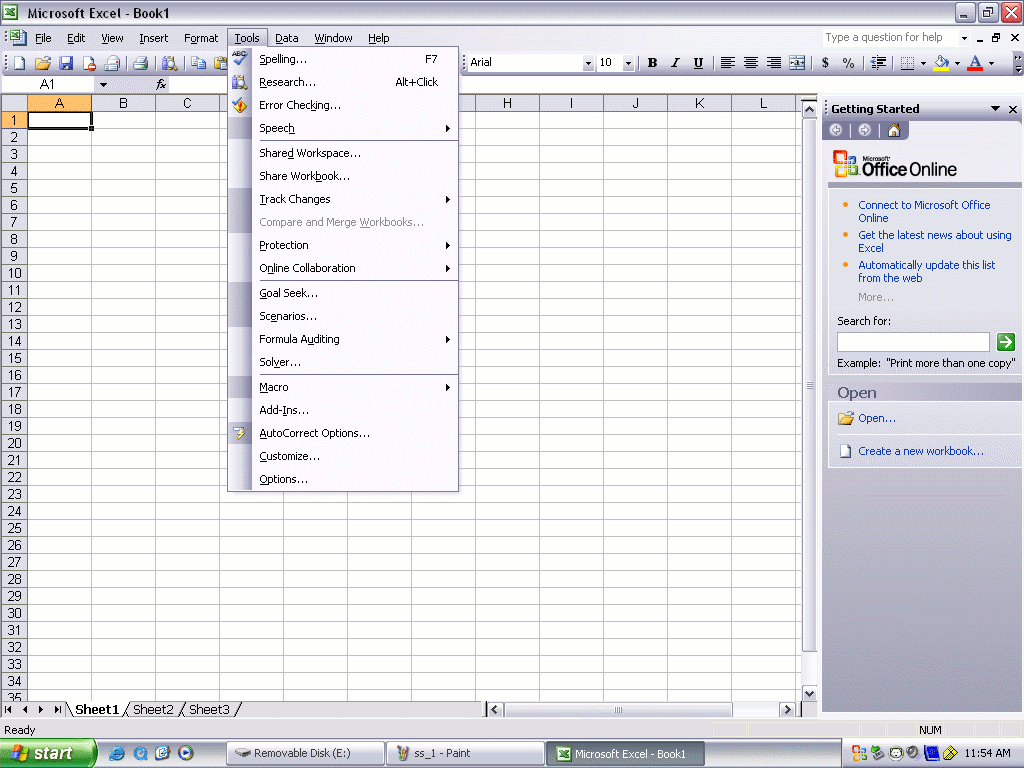
- Pull down the tools menu and look for a Data Analysis item:
- If it's there, the Data Analysis routines are installed
- If it's not there, they need to be installed.
In the example below, they are not installed:
- Click on the Add-Ins item in the tools menu.
The following dialog box should open:
- Check the Analysis Toolpak checkbox, then the OK button:
- Now the Tools pulldown menu should have a Data Analysis entry:
The data analysis routines are now installed and ready to use.
Importing the Data
- Open the spreadsheet and pull down the Data menu.
Select theImport External Data item and the Import Data subitem:
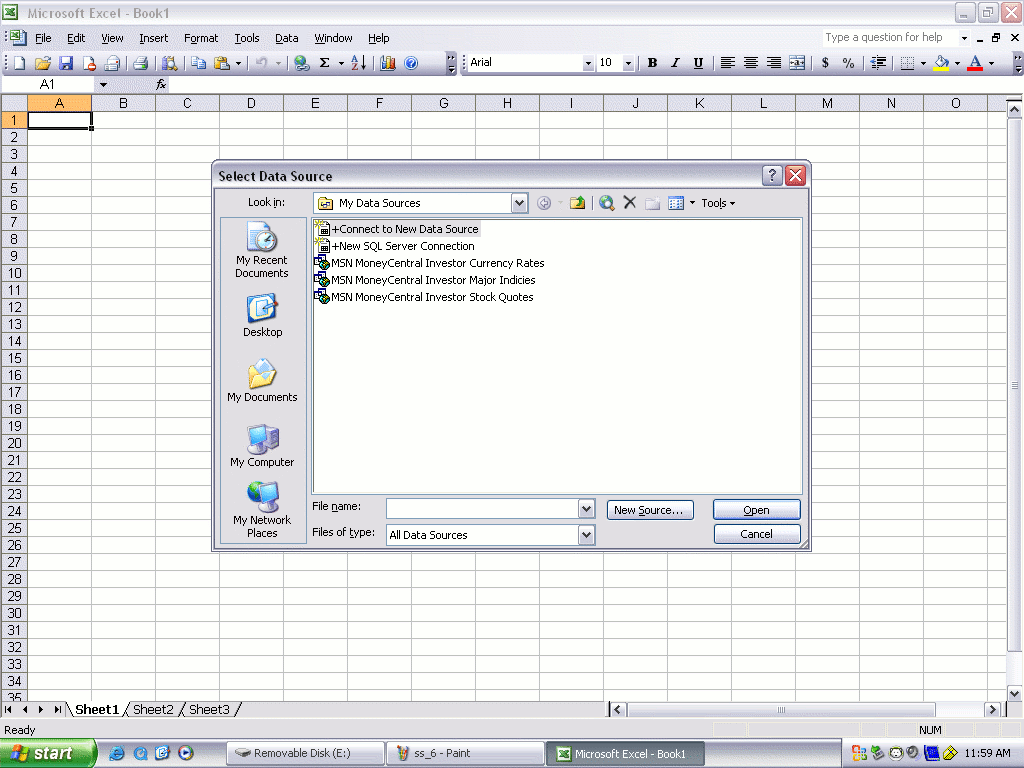
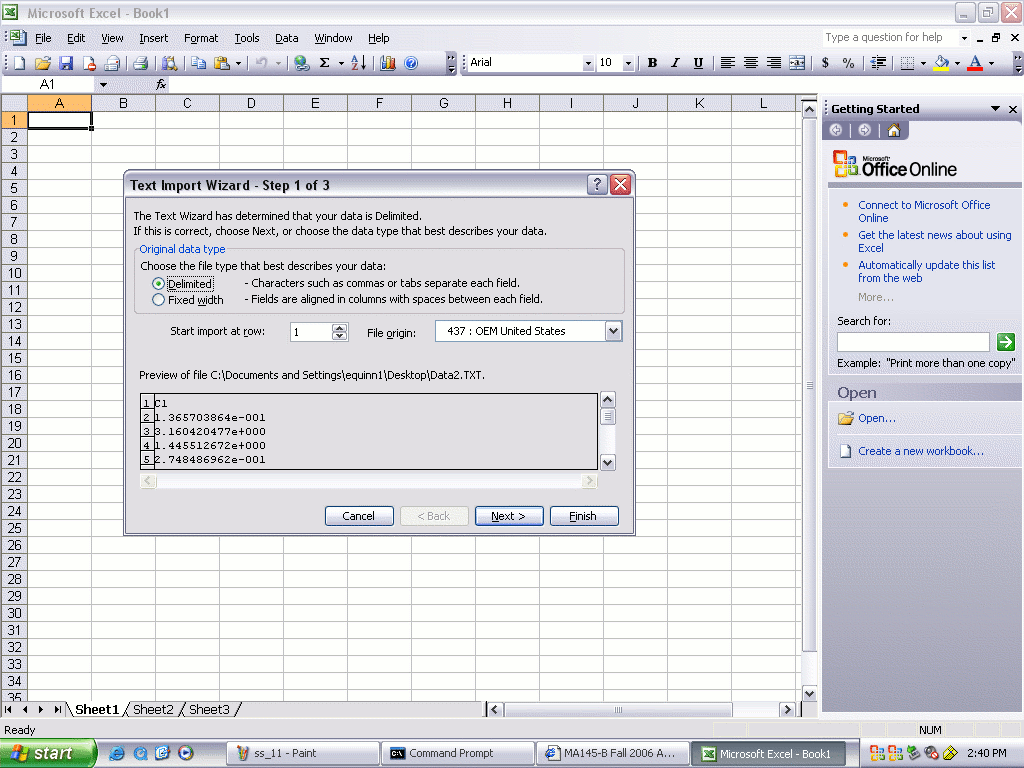
- The following dialog box should open:
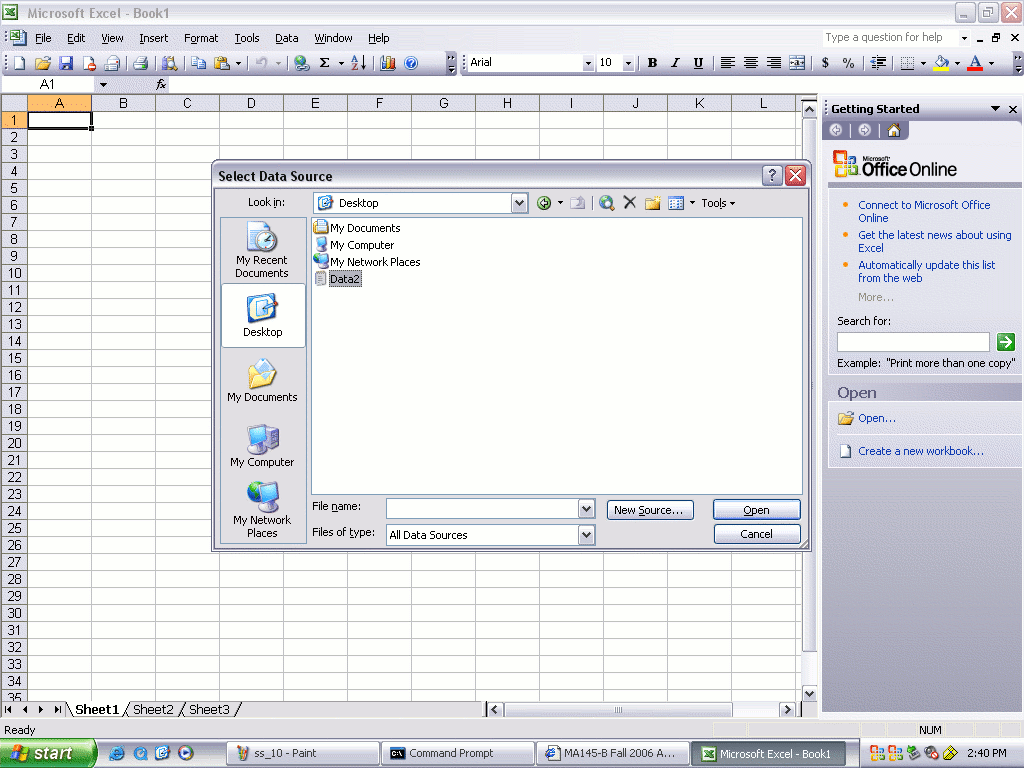
- Use the dialog box to specify where your input file is located. This is what
you would use if you had downloaded your file to the Desktop folder before starting:
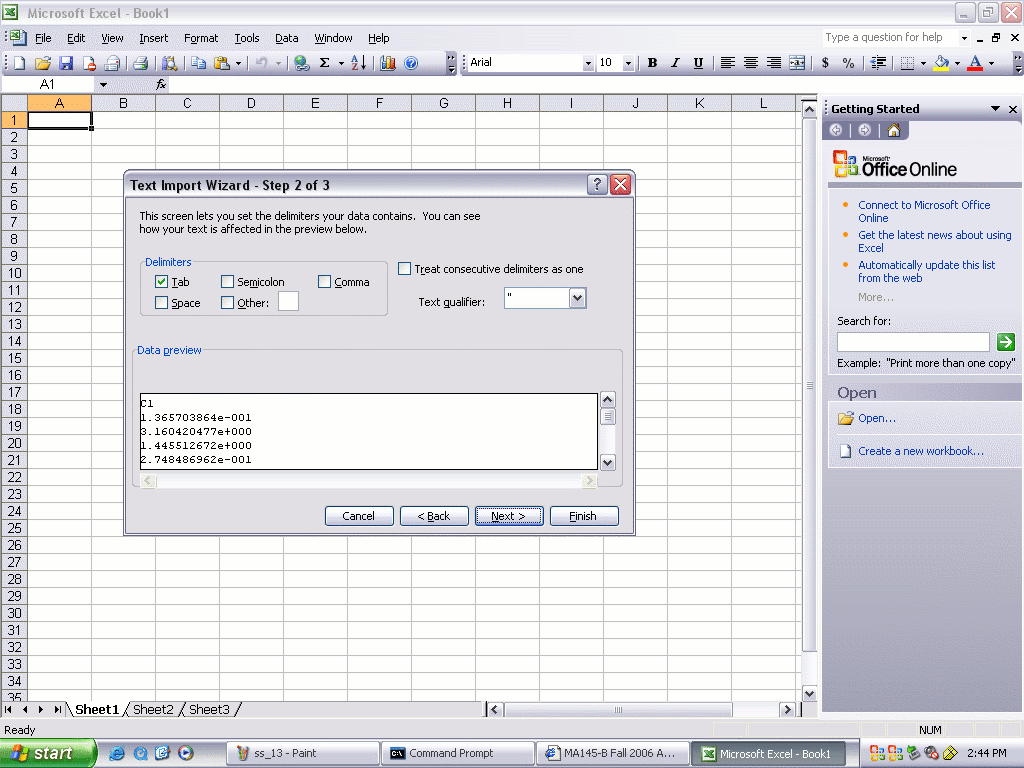
- Continue with the dialog:
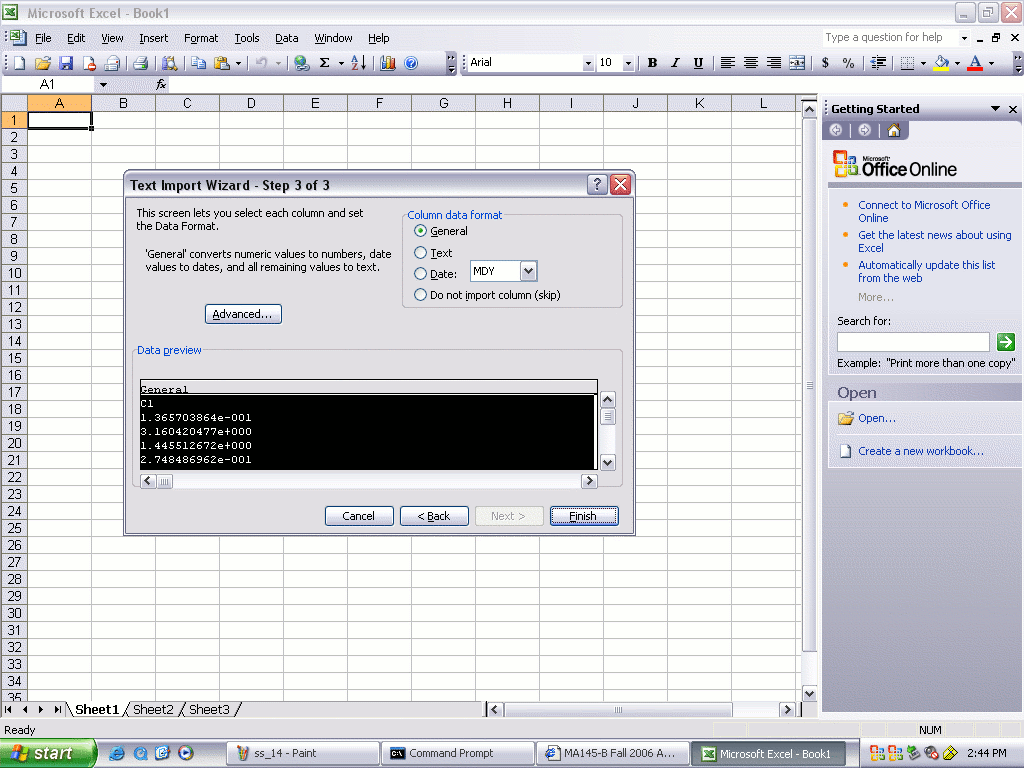
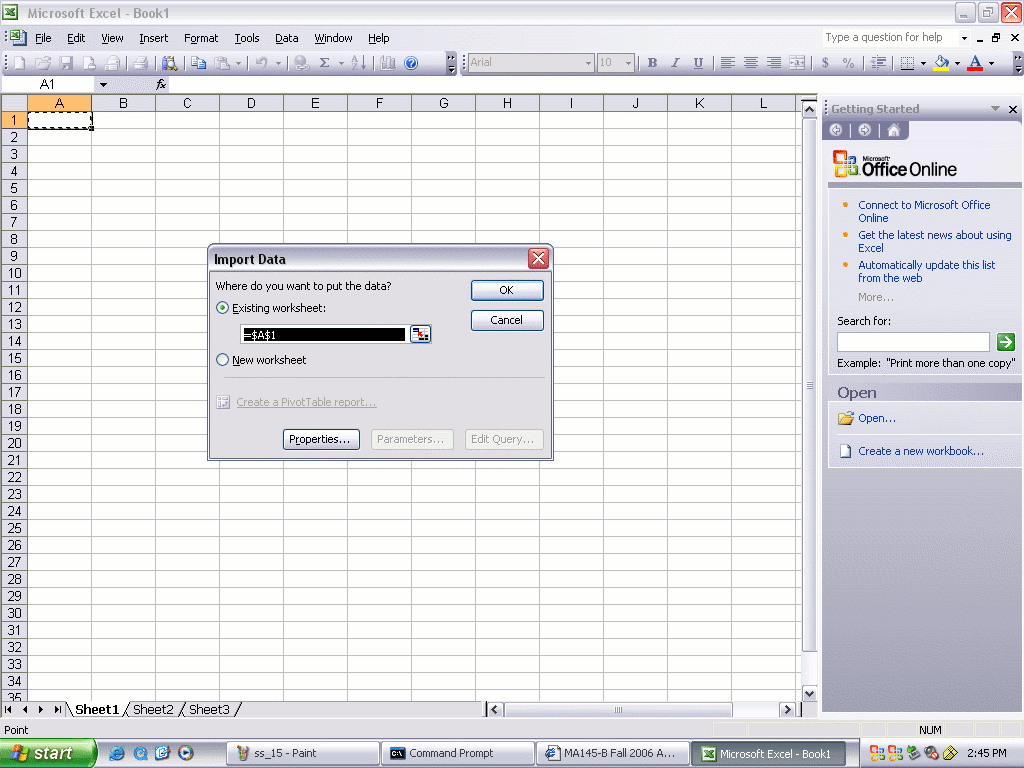
- Continue through the dialog:
Getting Basic Measures of Central Tendency and Dispersion
- Pull down the Data menu.
Select theData Analysis item
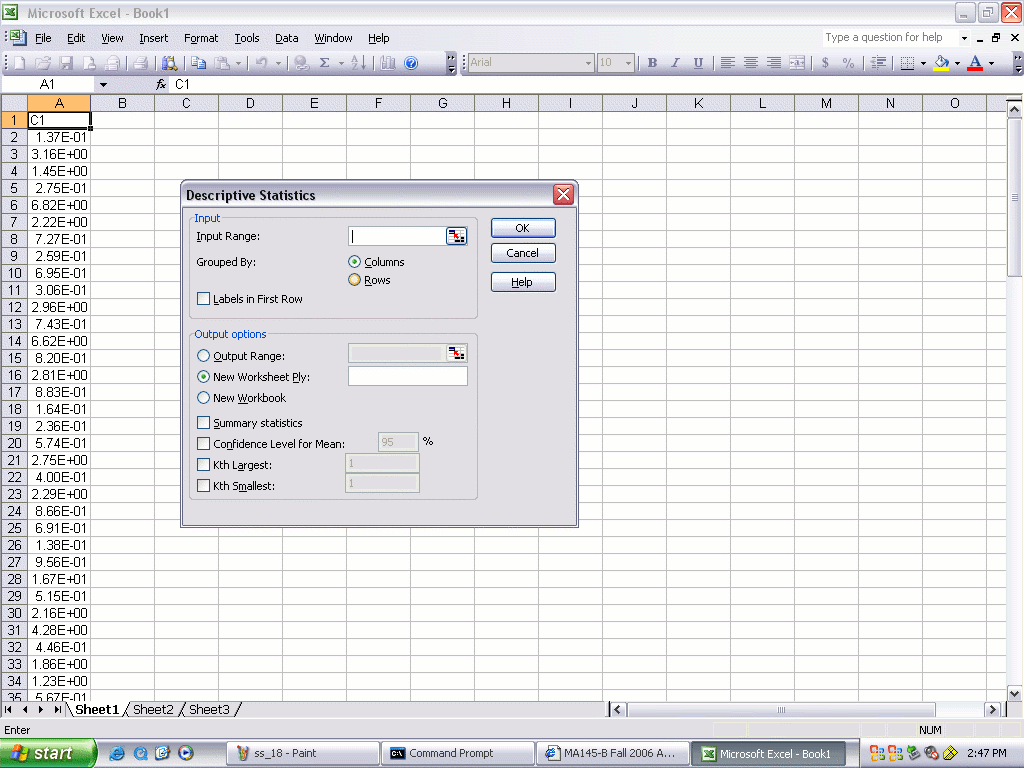
- The following dialog box appears:
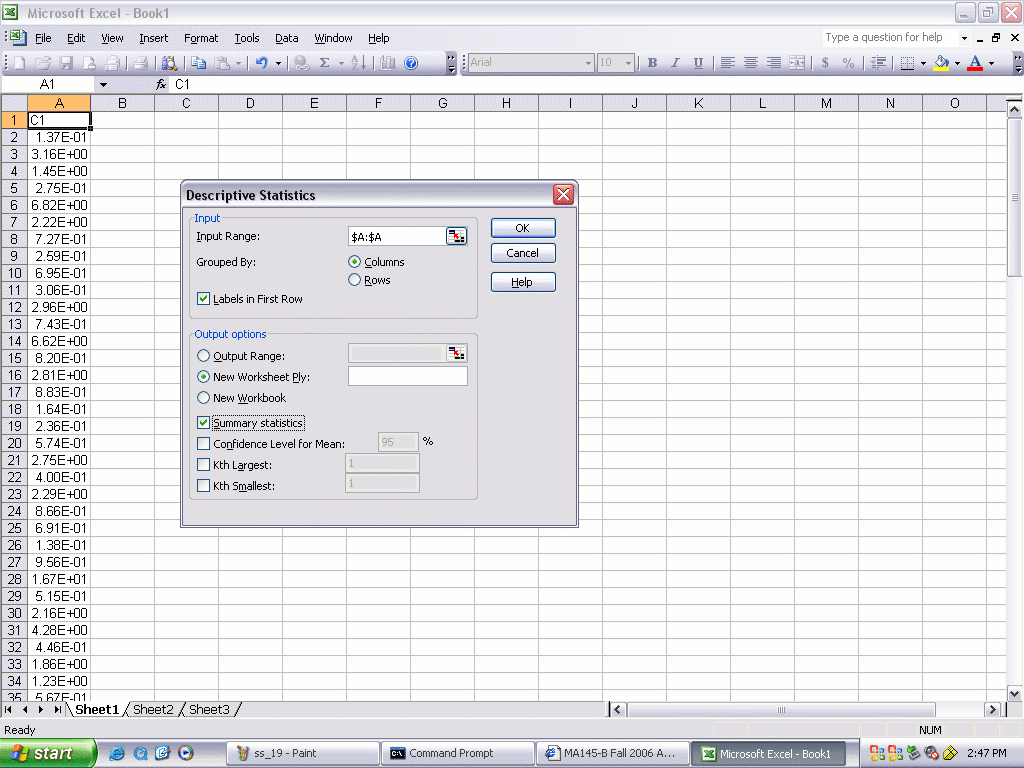
- Fill in the Input Range,
check the Labels in First Row and Summary statistics boxes:
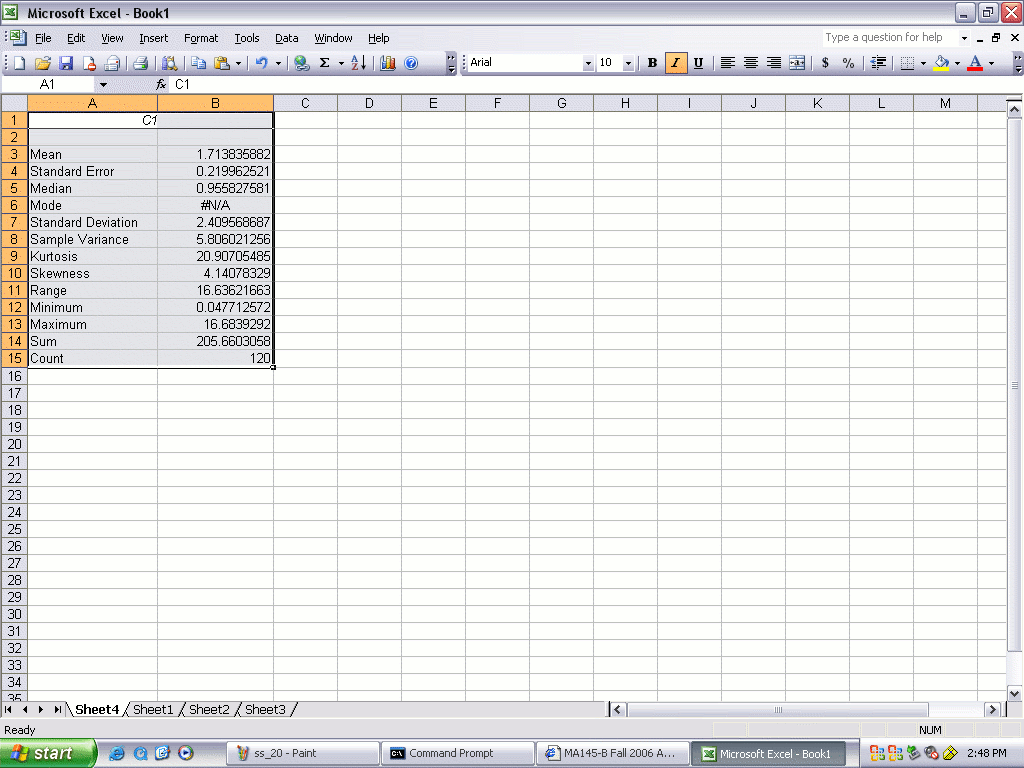
- The result should be something like this:
<\ol>
Getting Percentiles from the Spreadsheet
- Pull down the Data menu.
Select theData Analysis item,
then Rank and Percentile
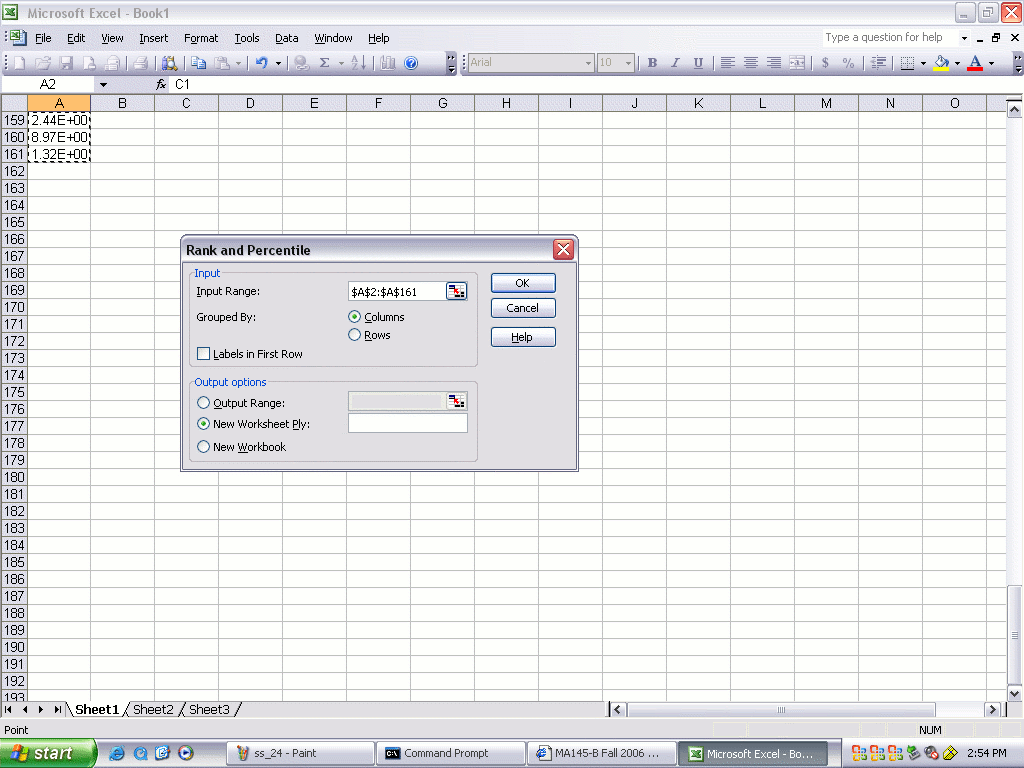
- The following dialog box should appear:
- Fill in the Input Range. Note that some versions
of the spreadsheet program will go into a loop if the entire
column is selected, so it's probably best to specify an exact range.
If you select a range that includes the first row, check the
Labels in First Row box.
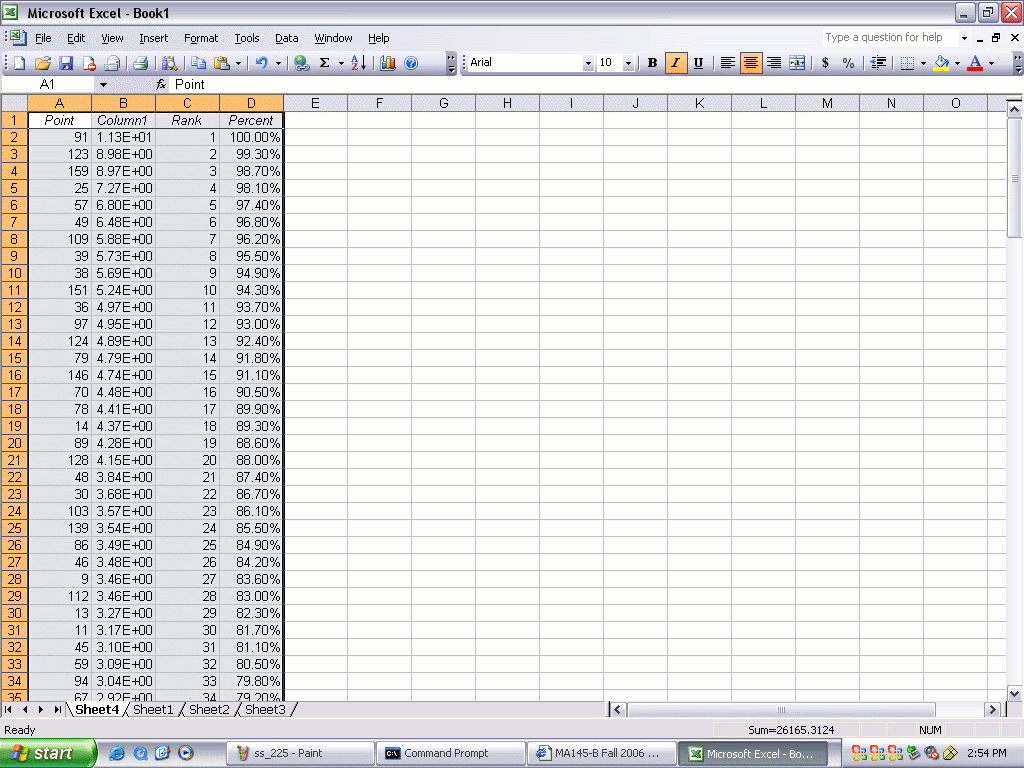
- The results should be something like this:
- Calculating percentiles using the table
Suppose we want to find the 95th percentile of the data using the table of percentiles
in the above image. Here is the procedure:
- Read down the list to the last number with a value in the Percent column that is strictly greater than 95.00%.
(In this list, it's row 8 with a value in the Percent column of 95.50% and a data value of 5.73E+00
or 5.73).
- Locate the row immediately below this one. This will be the first row in the table
with value in the Percent column less than or equal to 95.00%.
(In this list, it's row 9 with a percent value of 94.90% and a data value of 5.69E+00 or 5.69.)
- The average of the data values in these two rows is the 95th percentile.
(In this example, the data values are 5.73 and 5.69, and their average is 5.71. 5.71 is
the 95th percentile for this data).
Getting a Histogram
- Pull down the Data menu.
Select theData Analysis item,
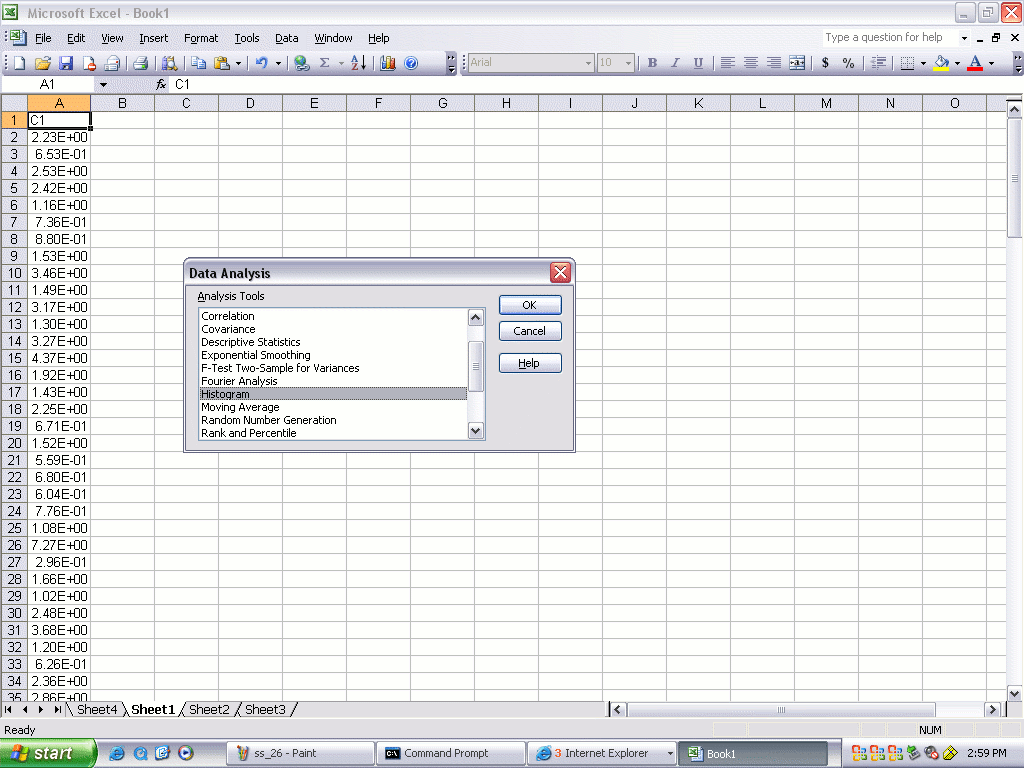
then Histogram
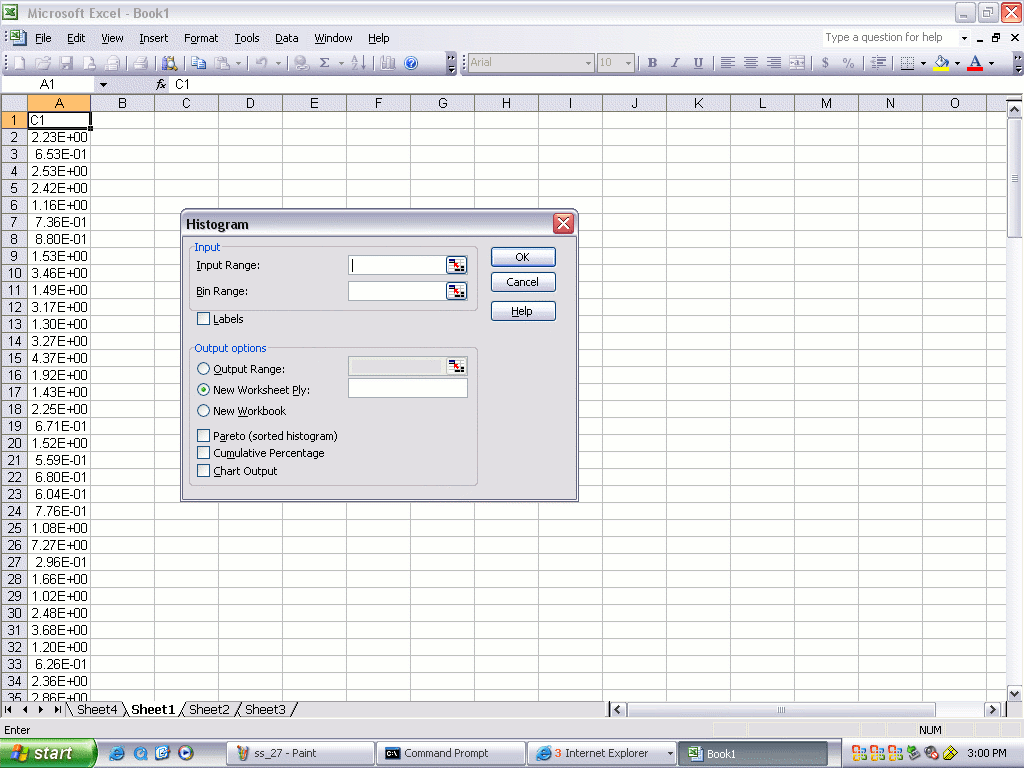
- Fill in the Input Range
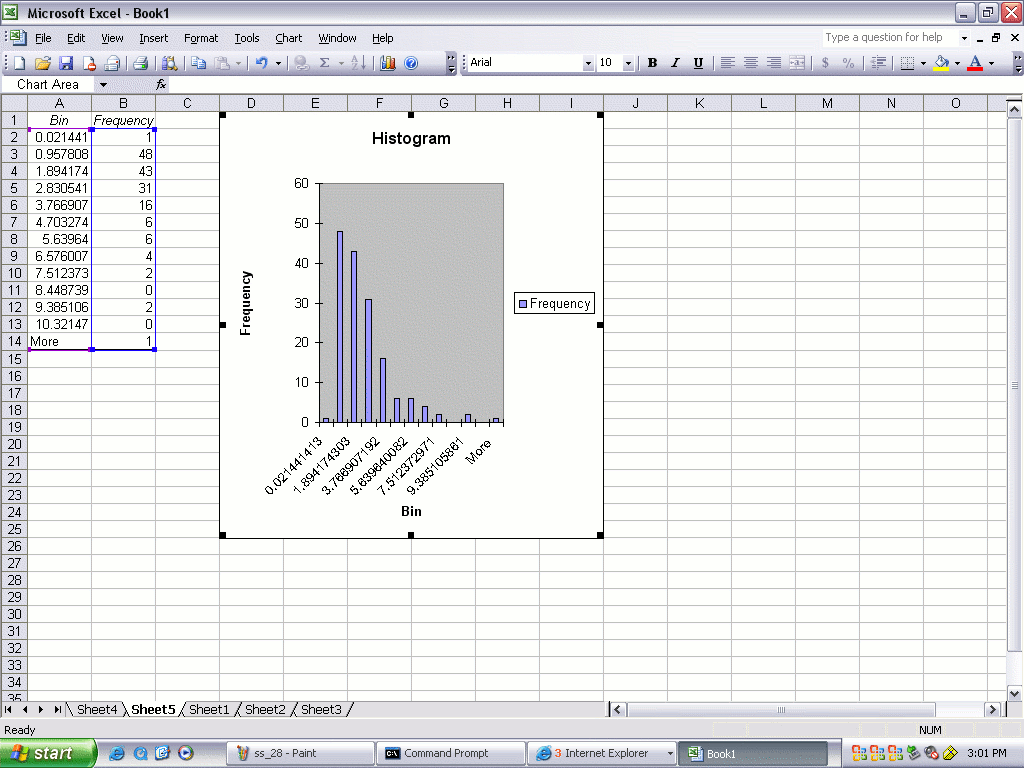
- After expanding the chart, the results should look something like this:
